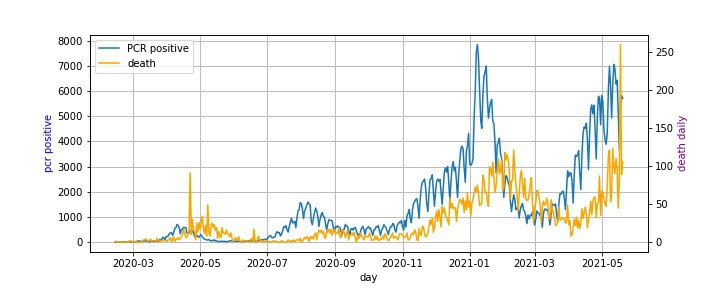
【matplotlib】縦2軸の折れ線グラフの描き方2_コロナ陽性者_死亡者
こちらで折れ線グラフの縦2軸の描き方が分かったので、調子に乗ってもう一個書いてみた。
【実行環境】
- Windows10 WSL:Ubuntu
- Jupyter Notebook
- Python3.8
- 外部ライブラリ
- pandas numpy matplotlib
import pandas as pd
import numpy as np
import matplotlib.pyplot as plt
import matplotlib.cm as cm
%matplotlib inline
f1 = './Covid19分析/pcr_positive_daily.csv'
f2 = "./Covid19分析/death_total.csv"
df1 = pd.read_csv(f1, index_col=0, parse_dates=True)
df2 = pd.read_csv(f2, index_col=0, parse_dates=True)
累計死亡者数を日毎に換算。
n = np.array(df2)
n_daily = np.append(1, np.diff(np.array(n[:,0])))
df2["死亡者(単日)"]  = n_daily
df2
| 死亡者数 | 死亡者(単日) | |
|---|---|---|
| 日付 | ||
| 2020-02-14 | 1 | 1 |
| 2020-02-15 | 1 | 0 |
| 2020-02-16 | 1 | 0 |
| 2020-02-17 | 1 | 0 |
| 2020-02-18 | 1 | 0 |
| ... | ... | ... |
| 2021-05-16 | 11504 | 45 |
| 2021-05-17 | 11587 | 83 |
| 2021-05-18 | 11847 | 260 |
| 2021-05-19 | 11936 | 89 |
| 2021-05-20 | 12042 | 106 |
462 rows × 2 columns
# PCR陽性者数と死亡者(単日)を結合
df_m = pd.merge(df1, df2.iloc[:, 1], right_index=True, left_index=True)
df_m
| PCR 検査陽性者数(単日) | 死亡者(単日) | |
|---|---|---|
| 日付 | ||
| 2020-02-14 | 7 | 1 |
| 2020-02-15 | 12 | 0 |
| 2020-02-16 | 6 | 0 |
| 2020-02-17 | 7 | 0 |
| 2020-02-18 | 7 | 0 |
| ... | ... | ... |
| 2021-05-16 | 5247 | 45 |
| 2021-05-17 | 3677 | 83 |
| 2021-05-18 | 5229 | 260 |
| 2021-05-19 | 5811 | 89 |
| 2021-05-20 | 5711 | 106 |
462 rows × 2 columns
fig = plt.figure(figsize=(10,4))

# PCR陽性者数をプロット
ax1 = fig.add_subplot(111)
ln1 = ax1.plot(df_m.iloc[:, 0], label='PCR positive')

# PCR検査実施件数をプロット
ax2 = ax1.twinx()
ln2 = ax2.plot(df_m.iloc[:, 1], label='death', color='orange')

# 凡例の設置
h1, l1 = ax1.get_legend_handles_labels()
h2, l2 = ax2.get_legend_handles_labels()
ax1.legend(h1+h2, l1+l2, loc='upper left')

# ラベルの設置
ax1.set_xlabel('day')
ax1.set_ylabel('pcr positive', color='blue')
ax2.set_ylabel('death daily',color='purple')

# グリッド線の設置
ax1.grid()

# グラフ保存
fig.savefig("pcr_positive_death.jpg")

# グラフ表示
plt.show()

5月半ばに死亡者数が突出している部分がある。怪しい。
一日の死亡者の高い日を確認する。100人を越えてる日にしようか。47都道府県あたり1日約2人のコロナ死亡者。
# 死亡者数(単日)が100人を超えた日のデータを抽出
df_m[df_m.iloc[:, 1] >= 100]
| PCR 検査陽性者数(単日) | 死亡者(単日) | |
|---|---|---|
| 日付 | ||
| 2021-01-22 | 4803 | 105 |
| 2021-01-27 | 3965 | 109 |
| 2021-01-30 | 3332 | 108 |
| 2021-02-02 | 2329 | 118 |
| 2021-02-03 | 2639 | 108 |
| 2021-02-04 | 2573 | 115 |
| 2021-02-05 | 2371 | 108 |
| 2021-02-10 | 1885 | 121 |
| 2021-05-07 | 6032 | 113 |
| 2021-05-08 | 6985 | 121 |
| 2021-05-11 | 6238 | 123 |
| 2021-05-12 | 7057 | 101 |
| 2021-05-14 | 6269 | 110 |
| 2021-05-18 | 5229 | 260 |
| 2021-05-20 | 5711 | 106 |
2021/05/18だけ2倍以上出ている。集計ミスか? これはおかしいねぇ。
【追記】
この日の兵庫県の死亡者は129名になっているようです。他県と比較しても桁違い。全国260人の半分だし。上で挙げたデータファイルのリンクにあるNHKの都道府県別のCSVデータを調べた。
全国の年間肺炎死亡者10万人を365日で割ると1日あたり274人。兵庫県のコロナ死亡者だけでその半分を占める計算になる。ベラボウ過ぎる。何かの間違いでは?【追記おわり】
【再追記】
どうやら未集計だった1ヶ月半分のものをこの日にまとめて計上したものらしい。
兵庫県は18日、新型コロナウイルスに感染していた129人の死亡が確認されたと発表しました。
このうち121人は、神戸市がことし3月26日から5月17日までの1か月半余りの期間に亡くなり、これまで計上していなかった人を、18日、まとめて発表したものです。(中略)
感染者の急増で保健所の業務がひっ迫し、遺族への意向確認などが滞っていたため、18日の発表となったとしています。
【再追記おわり】
死亡者数は陽性者数よりひと月ほど後ろにズレて出てくるんですね。
【参考リンク】
連続投稿は以上です。